The principle of conservation of energy requires that the energy incoming and outgoing remain in balance. An example of this is how Earth receives shortwave radiation from the Sun and emits longwave radiation back into space. This balance is referred to as Earth’s “radiation budget”. Greenhouse gasses in the atmosphere absorb some of the longwave radiation from Earth, and when there are more greenhouse gasses in the atmosphere, Earth must emit more longwave radiation to keep the radiation budget balanced. The increased longwave radiation warms the climate of Earth which results in global climate change (Science Mission Directorate).
While long term changes in global mean temperature are used as the statistical indicator of global climate change, it is difficult to fully realize the impact of climate change on a region through changes in this metric (Abatzoglou et al. 2014). Some locations of Earth may be experiencing cooling, while other regions on Earth may be experiencing warming. A global mean statistic is not always representative of the climate story for any given region. The difference in climate that each region experiences is called climate variability. To see the impact of climate change on a specific region, an analysis of regional climate data must be done.
Climate is the average of weather, and through the use of long-term weather data, an understanding of a region's climate is formed. Comparing historical regional climate data to modern regional climate data can elucidate the story of regional climate change. With the help of advanced computer climate models, historical climate data can be used to simulate future climate scenarios within certain degrees of accuracy. The simulations help researchers understand the impact of varying conditions such as how the global or regional mean temperature may change if anthropogenic CO2 emissions continue to climb (“Climate Change”).
Both historical climate data and computer climate models can be used to understand the changing climate of a region. For example, the Pacific Northwest is a mid-latitude region with many climate influences like the Pacific Ocean, the Cascade Mountains, and the Columbia Gorge. As global emissions of greenhouse gasses continue to rise, how is the climate of the Pacific Northwest changing, if at all? Through the analysis of historical climate data and the use of computer climate models, it is clear that the Pacific Northwest is warming, spring is experiencing an increase in precipitation, and both trends are likely to continue due to climate change.
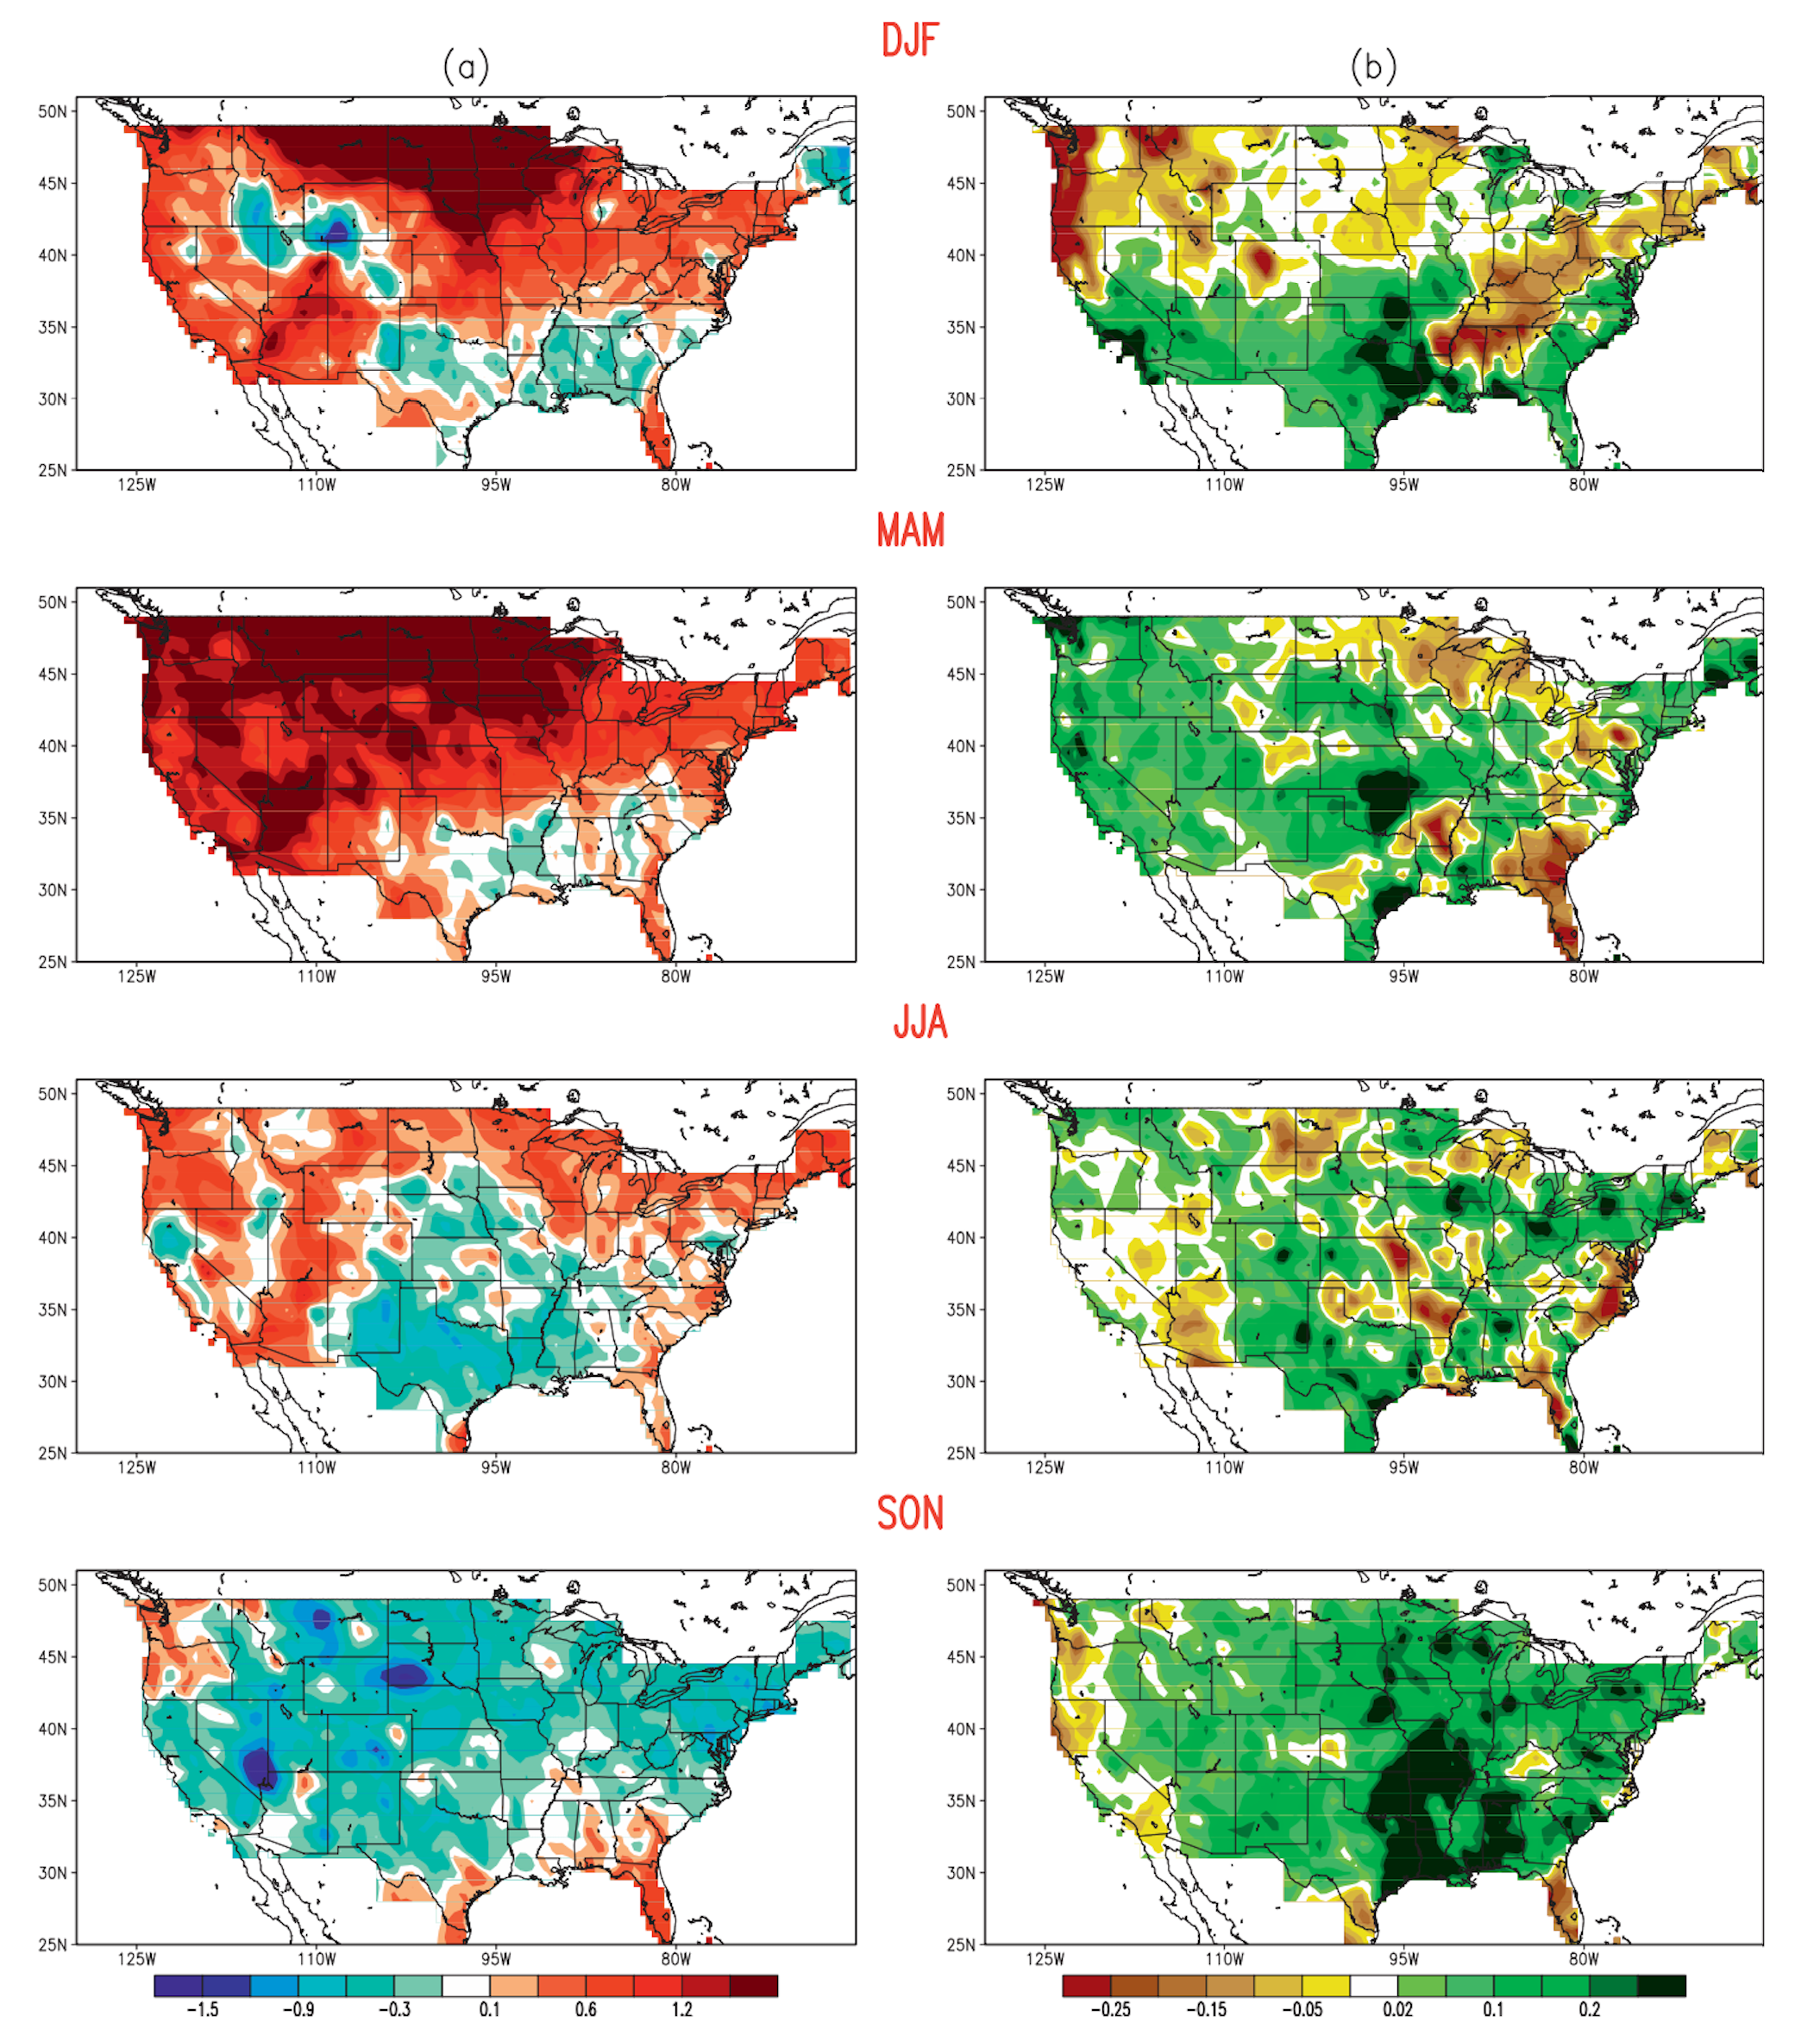
According to historical climate data, the Pacific Northwest is warming. Between 1895 and 2011, the Pacific Northwest warmed by 1.3 Fahrenheit, and the frost-free season has lengthened by almost 35 days (“Climate Change”). There was an increase in the temperature of the coldest night of each winter, the maximum and minimum temperature have increased, and there has been warming across every season (Abatzoglou et al. 2014). Figure 1a shows the linear trends in surface air temperature (Kelvin) for the years 1950-2000. The seasons are listed as DJF (December - February, winter), MAM (March - May, spring), JJA (June - August, summer), and SON (September - November, fall). The orange and red indicate an increase in surface air temperature over the time period of 1950-2000. In the Pacific Northwest region, every season is indicated as experiencing warming of varying intensity (Wang et al. 2009).
Historical climate data shows that the Pacific Northwest is experiencing increased precipitation in spring. Seasonal trends from 1901-2000 show a strong statistical increase in the precipitation in spring. Precipitation in spring was 30% above twentieth-century normals during 2009 to 2012 (Abatzoglou et al. 2014). Figure 1b shows the linear trends in precipitation (mm/day) for the years 1950-2000. The green colors represent an increase in precipitation. In the Pacific Northwest region, the spring season is indicated as experiencing the greatest increase in precipitation.
Climate modeling done by Abatzoglou et al. in 2014 found long-term increases in spring precipitation are likely to continue due to anthropogenic increases of CO2 (Abatzoglou et al. in 2014). CO2 is one of the most common greenhouse gasses in Earth’s atmosphere, and as of 2022, the CO2 concentration in Earth’s atmosphere is at least 417 ppm (Lindsey). The work of Leung and Ghan simulated a climate model of the Pacific Northwest under a control scenario and a scenario where twice as much CO2 was present. The control simulation used CO2 concentrations of 340 ppm. The increased CO2 experiment used a concentration of 680 ppm. They found that there was an increase in temperature in all seasons in the increased CO2 experiment. The increased CO2 models also showed a lot of variation in the possible precipitation outcomes, but the only season with a statistically significant signal was spring. This led the authors to conclude that spring would most likely see an increase in precipitation (Leung and Ghan 1999).
Over the last 100 years, historical climate data has shown that the Pacific Northwest is getting warmer, and it is experiencing increased precipitation. Advanced computer climate models indicate that the continued increase of CO2 in the Earth’s atmosphere will most likely continue to cause this region to see an increase in temperature across all seasons as well as an increase in precipitation in the spring.